Scale functions to use with GGPlot2
scales.Rdscale_fill_* and scale_colour_* functions
scale_fill_core_range(...)

scale_colour_core_range(...)

scale_color_core_range(...)

scale_fill_munro(...)

scale_colour_munro(...)

scale_color_munro(...)
Arguments
| ... | see ggplot2 documentation |
|---|
Examples
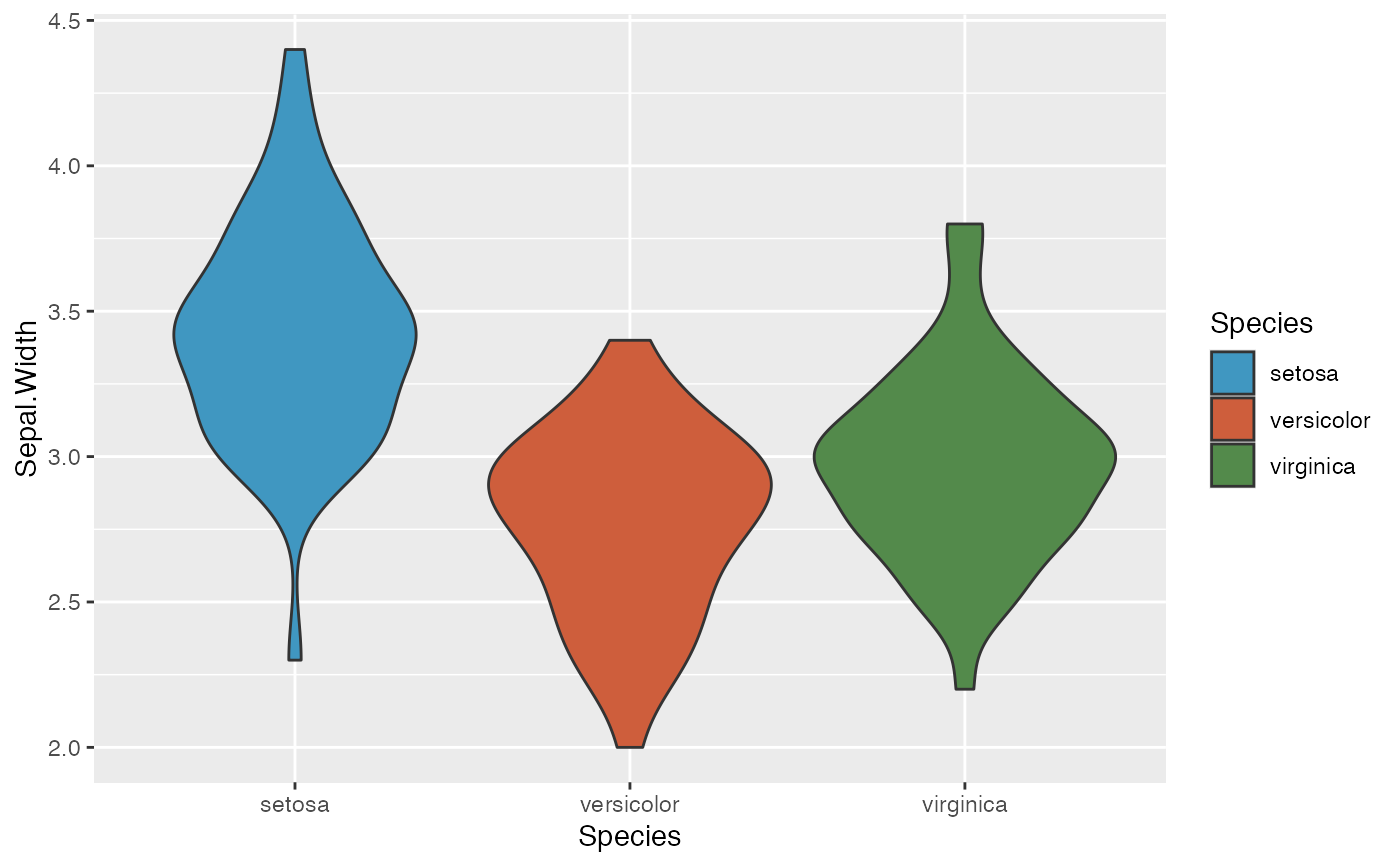
library(ggplot2) ggplot(iris,aes(x=Species,y=Sepal.Width,fill=Species))+ geom_violin()+scale_fill_core_range()